Scoring MSFT against its own self-selected peers
In July of 2004, John Connors (then MSFT CFO), presented the following slide in a presentation to financial analysts: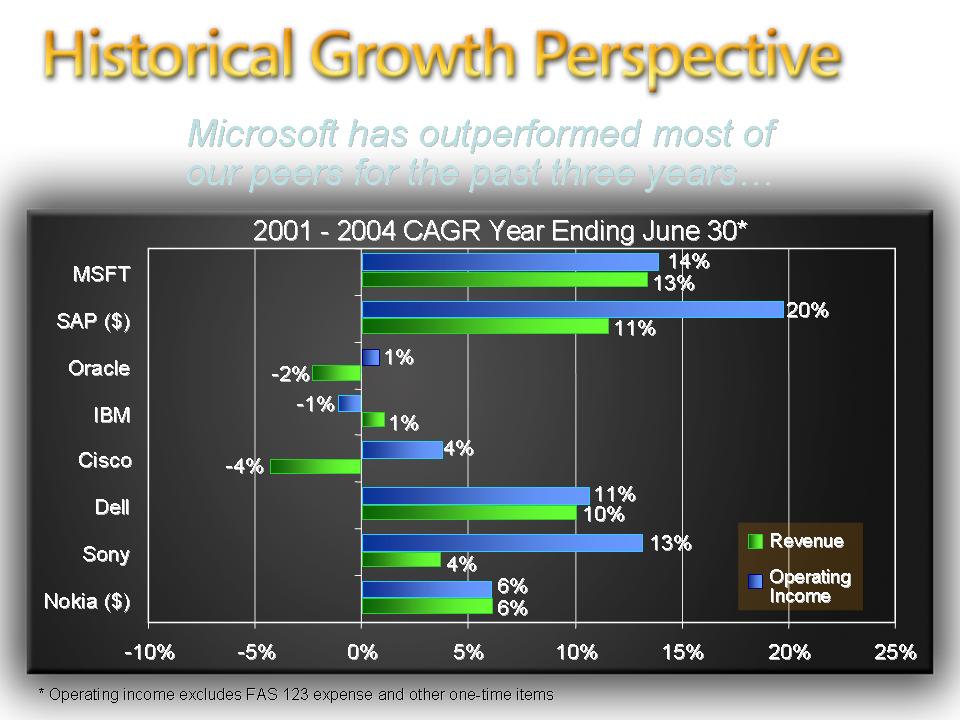
To see the full slide deck and/or read the presentation transcript, click here.
The basic message was that the company had outperformed many of its peers on key financial metrics such as revenue and operating income. Now you could argue that MSFT's near-monopoly and massive recurring revenue was a huge relative advantage in the aftermath of the 2000 technology bust, but that's a seperate debate. In fact, I'm not bringing up the slide to fault the analysis or John Connors for making it; it was a reasonable point and Connors was a very capable CFO who's subsequent departure imo was a big loss to MSFT (and perhaps foreshadowed some of the current messs). The reason I bring up the slide is that it was one of the first times that MSFT provided its own view of who it should be compared to.
Keep in mind that at the time, MSFT has already underperformed most of these names badly from a stock perspective - a fact that was conveniently omitted from the analysis. Today, of course, it's company MO not to mention the stock or even go as far as Ballmer's ridiculous “We have never really used the stock market itself as a barometer of our success” uttered at the last shareholder meeting no less. But I thought it would be interesting to see how MSFT's stock performance has compared to these names two years later.
Using a 5-year chart, MSFT is down approximately 40% (yes, I'm leaving off the incredibly stupid $3 one-time and collective dividends). Here's how the rest of the list has done:
- SAP +40%
- ORCL -30%
- IBM -32%
- CSCO +10%
- DELL -2%
- SNE -35%
- NOK -10%
In other words, MSFT has underperformed not just some of them, but ALL of them. But wait, it gets worse. Inquiring minds might note that even in 2004, that list was pretty self-serving and excluded obvious competitors like Salesforce.com, Google, Yahoo, Redhat, and Apple. How have those folks done over the past 5 years?:
- CRM +60%
- GOOG +275%
- YHOO +200%
- RHAT +575%
- AAPL +400%
Oh, and the NASDAQ itself over that period? Flat (0%).
Bottom line, 40% underperformance versus the index, lagged every one of its self-selected peers and wasn't even in the same league as several of its most formidable competitors. I give that a score of "F" for fail and only because miserable failure isn't available.
posted by MSFTextrememakeover at
9:32 AM
![]()

1 Comments:
Here's why MSFT stock *must* be the barometer of success:
I recently have been spending lots of time with various far-flung areas of the company - different international subsidiaries, different sales channels. Our team is working on (unannounced) projects which are projected to bring in several billions of dollars to the company every year for the next few years. What's the problem? The problem is that in the short term these same projects are likely to reduce income in some sales channel/subsidiary intersections while greatly spiking in others. In areas where the income *might* be temporarily reduced (the data is actually pretty ambiguous)we face entrenched opposition from stakeholders from the director level on down who see no personal upside to taking on whatever risk our projects might entail. Since there is no longer a shared metric of success (like a rising stock price and wide-spread employee stock ownership)it's perfectly logical (though corporately perverse) for these people to resist increasing Microsoft overall income.
By Anonymous, at 9:20 AM
Post a Comment
<< Home